Get to know Query view
This tutorial demonstrates some useful features built into Query view in Apache Druid.
Query view lets you run Druid SQL queries and native (JSON-based) queries against ingested data.
You can use Query view to test and tune queries before you use them in API requests—for example, to perform SQL-based ingestion. You can also ingest data directly in Query view.
The tutorial guides you through the steps to ingest sample data and query the ingested data using some Query view features.
Prerequisites
Before you follow the steps in this tutorial, download Druid as described in the quickstart and have it running on your local machine. You don't need to have loaded any data.
Run a demo query to ingest data
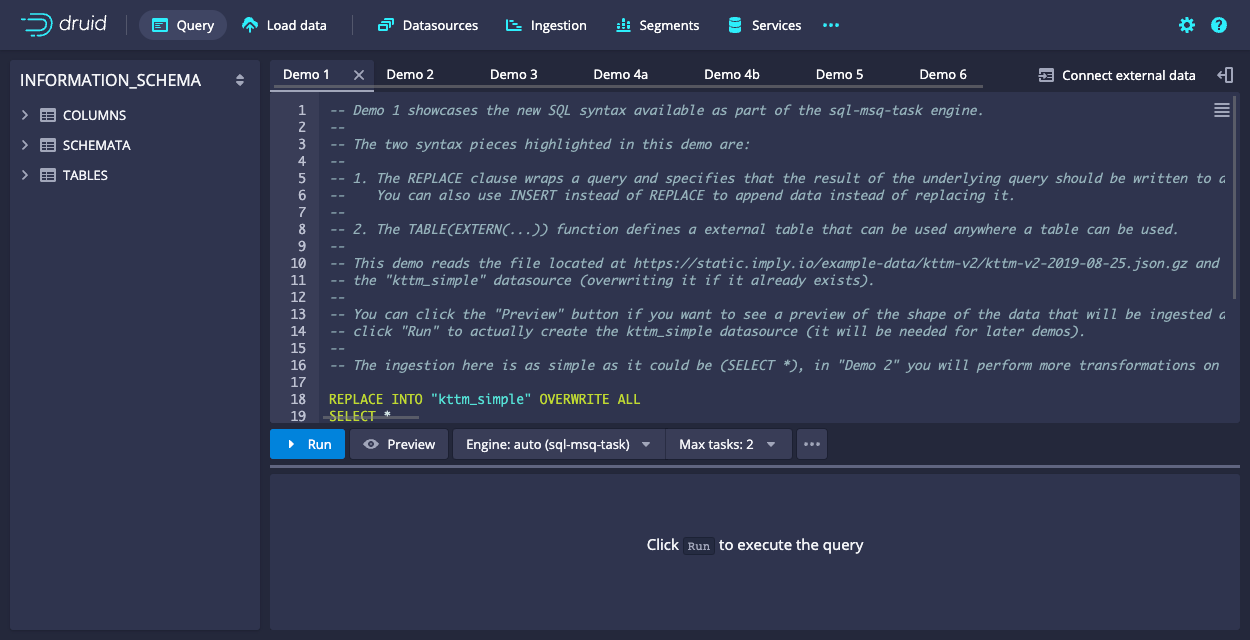
Druid includes demo queries that each demonstrate a different Druid feature—for example transforming data during ingestion and sorting ingested data. Each query has detailed comments to help you learn more.
In this section you load the demo queries and run a SQL task to ingest sample data into a table datasource.
-
Navigate to the Druid console at http://localhost:8888 and click Query.
-
Click the ellipsis at the bottom of the query window and select Load demo queries. Note that loading the demo queries replaces all of your current query tabs. The demo queries load in several tabs:
-
Click the Demo 1 tab. This query ingests sample data into a datasource called kttm_simple. Click the Demo 1 tab heading again and note the options—you can rename, copy, and duplicate tabs.
-
Click Run to ingest the data.
-
When ingestion is complete, Druid displays the time it took to complete the insert query, and the new datasource kttm_simple displays in the left pane.
View and filter query results
In this section you run some queries against the new datasource and perform some operations on the query results.
-
Click + to the right of the existing tabs to open a new query tab.
-
Click the name of the datasource kttm_simple in the left pane to display some automatically generated queries:
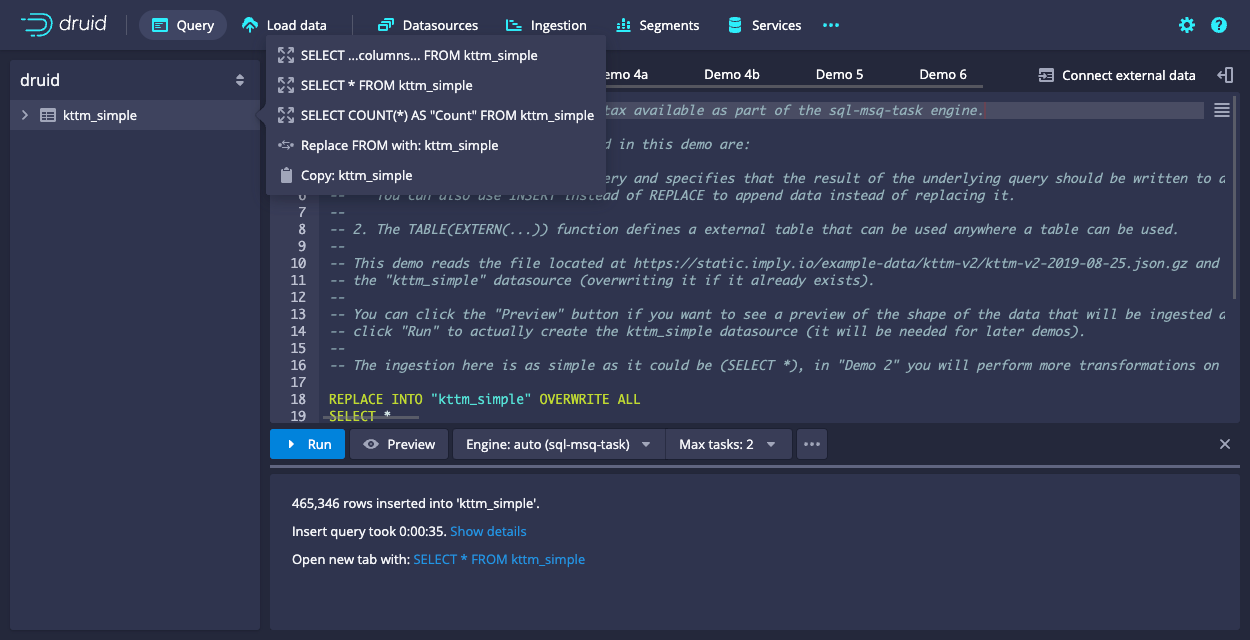
-
Click SELECT * FROM kttm_simple and run the query.
-
In the query results pane, click Chrome anywhere it appears in the browser column then click Filter on: browser = 'Chrome' to filter the results.
Run aggregate queries
Aggregate functions allow you to perform a calculation on a set of values and return a single value.
In this section you run some queries using aggregate functions and perform some operations on the results, using shortcut features designed to help you build your query.
-
Open a new query tab.
-
Click kttm_simple in the left pane to display the generated queries.
-
Click SELECT COUNT(*) AS "Count" FROM kttm_simple and run the query.
-
After you run a query that contains an aggregate function, additional Query view options become available.
Click the arrow to the left of the kttm_simple datasource to display the columns, then click the country column. Several options appear to apply country-based filters and aggregate functions to the query:
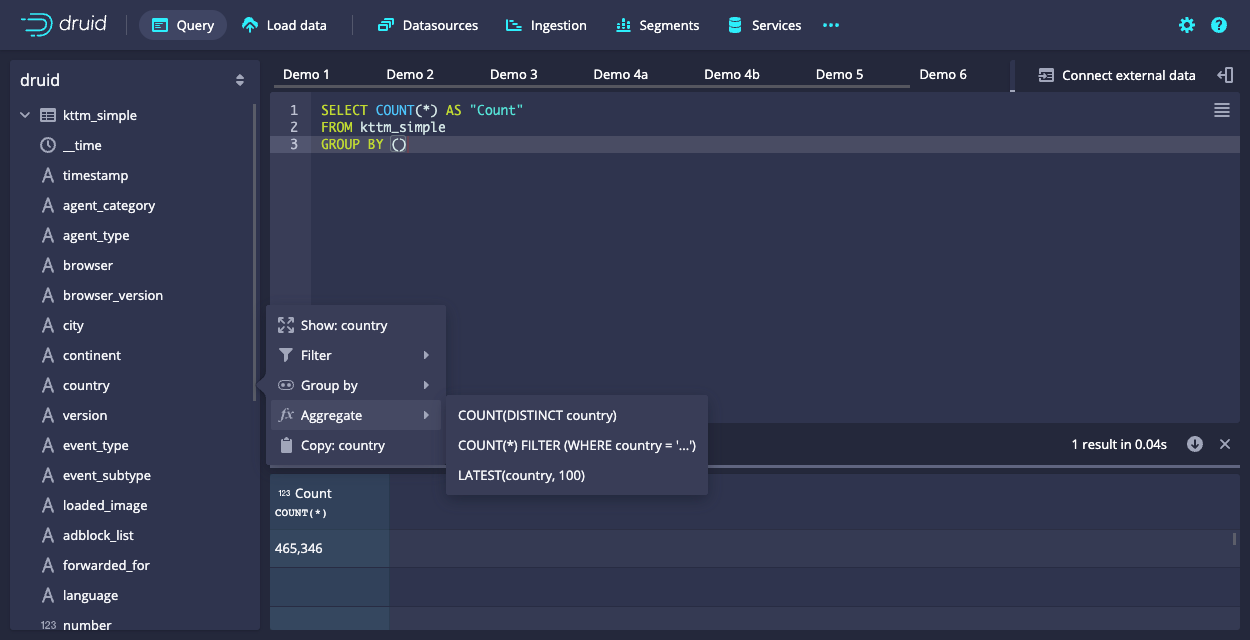
-
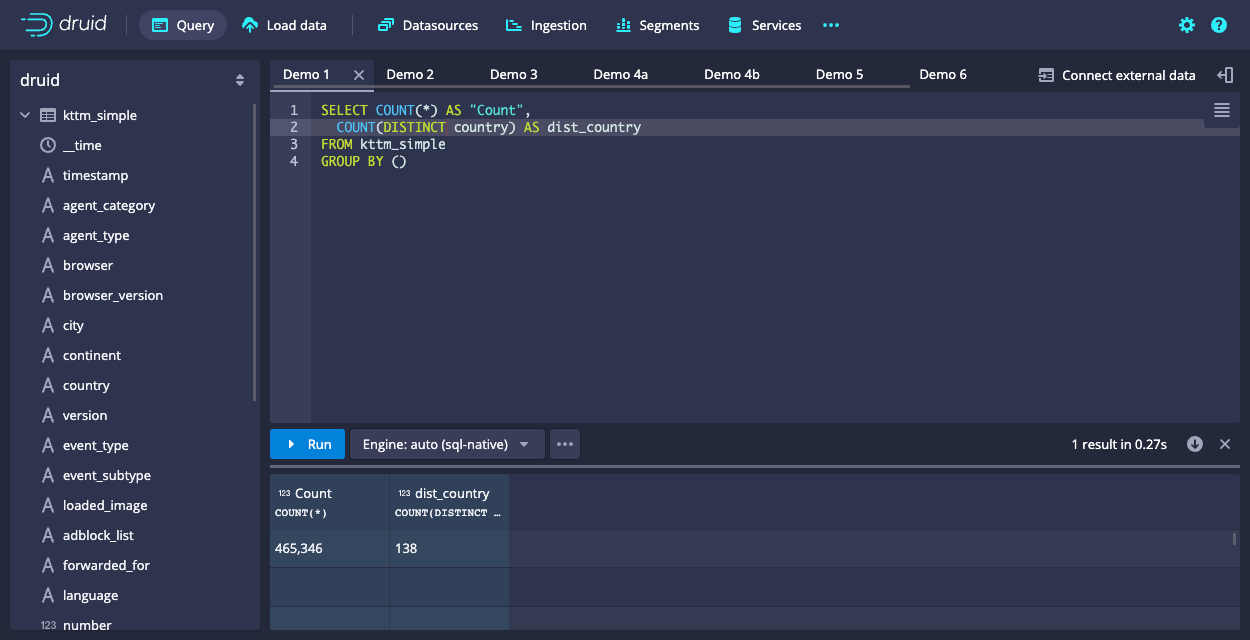
Click Aggregate > COUNT(DISTINCT "country") to add this clause to the query. The query now appears as follows:
SELECT COUNT(*) AS "Count",
   COUNT(DISTINCT "country") AS "dist_country"
FROM "kttm_simple"
GROUP BY ()
Note that you can use column names such as
dist_countryin this example as shortcuts when building your query. -
Run the updated query:
-
Click Engine: Auto (SQL native) to display the engine options—Native for native (JSON-based) queries, SQL native for Druid SQL queries, and SQL MSQ-task for SQL-based ingestion.
Select Auto to let Druid select the most efficient engine based on your query input.
-
From the engine menu you can also edit the query context and turn off some query defaults.
Deselect Use approximate COUNT(DISTINCT) and rerun the query. The country count in the results decreases because the computation has become more exact. See SQL aggregation functions for more information.
-
Query view can provide information about a function, in case you aren't sure exactly what it does.
Delete the contents of the query line
COUNT(DISTINCT country) AS dist_countryand typeCOUNT(DISTINCT)to replace it. A help dialog for the function displays: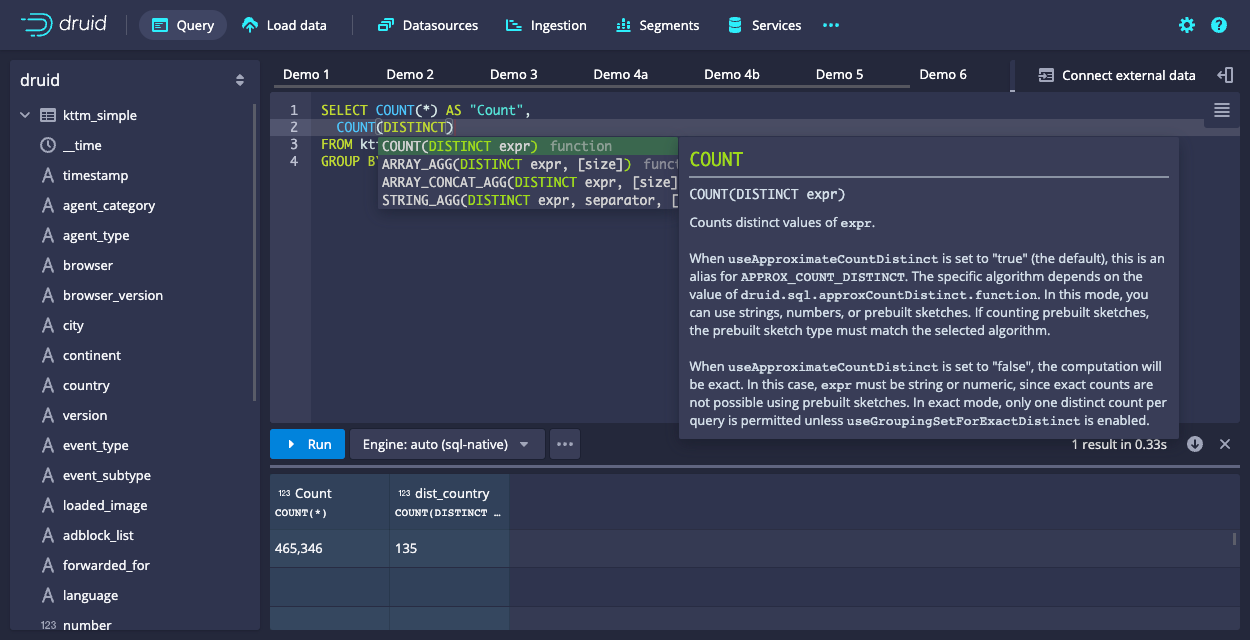
Click outside the help window to close it.
-
You can perform actions on calculated columns in the results pane.
Click the results column heading dist_country COUNT(DISTINCT "country") to see the available options:
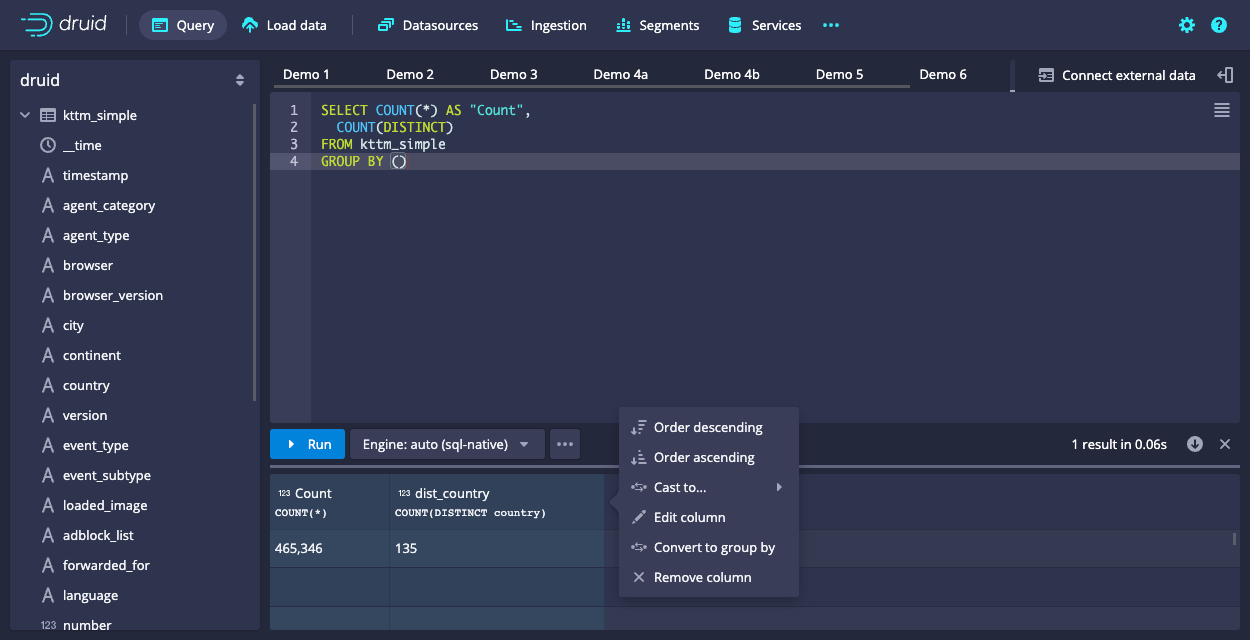
-
Select Edit column and change the Output name to Distinct countries.
Generate an explain plan
In this section you generate an explain plan for a query. An explain plan shows the full query details and all of the operations Druid performs to execute it.
Druid optimizes queries of certain types—see SQL query translation for information on how to interpret an explain plan and use the details to improve query performance.
-
Open a new query tab.
-
Click kttm_simple in the left pane to display the generated queries.
-
Click SELECT * FROM kttm_simple and run the query.
-
Click the ellipsis at the bottom of the query window and select Explain SQL query. The query plan opens in a new window:
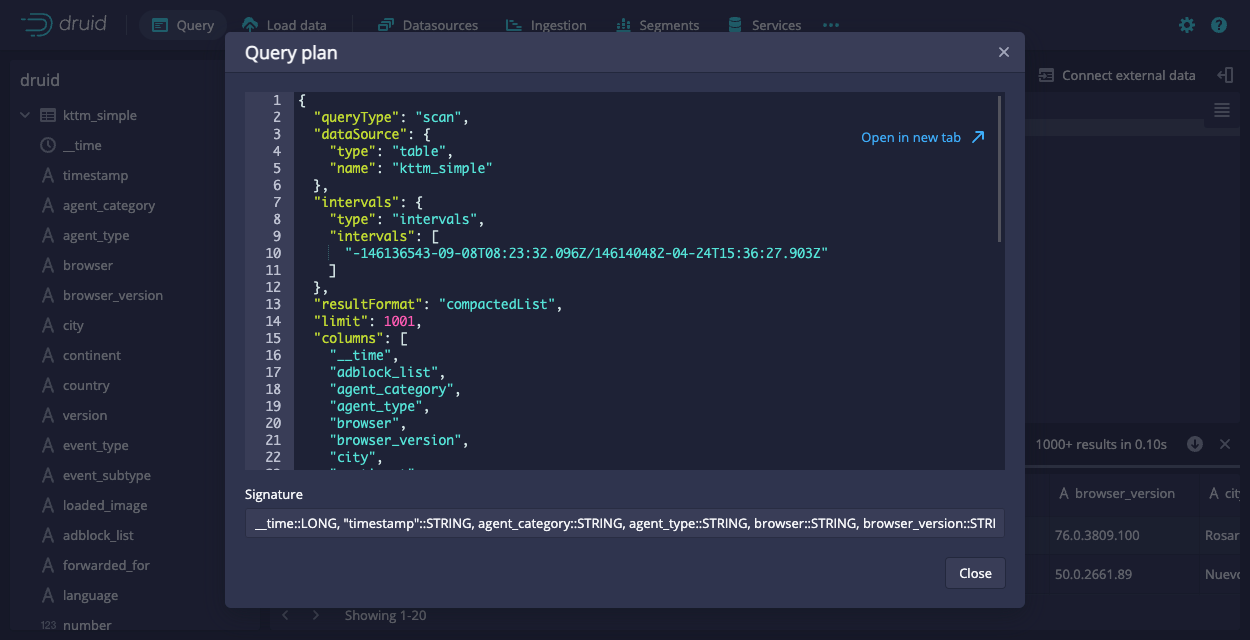
-
Click Open in new tab. You can review the query details and modify it as required.
-
Change the limit from 1001 to 2001:
"Limit": 2001,and run the query to confirm that the updated query returns 2,001 results.
Try out a few more features
In this section you try out a few more useful Query view features.
Use calculator mode
Queries without a FROM clause run in calculator mode—this can be useful to help you understand how functions work. See the Druid SQL functions reference for more information.
-
Open a new query tab and enter the following:
SELECT SQRT(49) -
Run the query to produce the result
7.
Download query results
You can download query results in CSV, TSV, or newline-delimited JSON format.
-
Open a new query tab and run a query, for example:
SELECT DISTINCT platform
FROM kttm_simple -
Above the results pane, click the down arrow and select Download results as… CSV.
View query history
In any query tab, click the ellipsis at the bottom of the query window and select Query history.
You can click the links on the left to view queries run at a particular date and time, and open a previously run query in a new query tab.
Further reading
For more information on ingestion and querying data, see the following topics:
- Quickstart for information on getting started with Druid.
- Tutorial: Querying data for example queries to run on Druid data.
- Ingestion for an overview of ingestion and the ingestion methods available in Druid.
- SQL-based ingestion for an overview of SQL-based ingestion.
- SQL-based ingestion query examples for examples of SQL-based ingestion for various use cases.
- Introduction to Druid SQL to learn more about Druid SQL.