Approximations with Theta sketches
Apache Druid can power real-time collection, streaming, and interactive visualization of clickstreams. A common problem in clickstream analytics is counting unique things, like visitors or sessions. Generally this involves scanning through all detail data, because unique counts do not add up as you aggregate the numbers.
The problem with counts and set operations on large data sets
Imagine you are interested in the number of visitors that watched episodes of a TV show. Let's say you found that at a given day, 1000 unique visitors watched the first episode, and 800 visitors watched the second episode. You may want to explore further trends, for example:
- How many visitors watched both episodes?
- How many visitors are there that watched at least one of the episodes?
- How many visitors watched episode 1 but not episode 2?
There is no way to answer these questions by just looking at the aggregated numbers. You would have to go back to the detail data and scan every single row. If the data volume is high enough, this may take a very long time, meaning that an interactive data exploration is not possible.
An additional nuisance is that unique counts don't work well with rollups. For this example, it would be great if you could have just one row of data per 15 minute interval1, show, and episode. After all, you are not interested in the individual user IDs, just the unique counts.
Is there a way to avoid crunching the detail data every single time, and maybe even enable rollup? Enter Theta sketches.
Use Theta sketches for fast approximation with set operations
Use Theta sketches to obtain a fast approximate estimate for the distinct count of values used to build the sketches. Theta sketches are a probabilistic data structure to enable approximate analysis of big data with known error distributions. Druid's implementation relies on the Apache DataSketches library.
The following properties describe Theta sketches:
- Similar to other sketches, Theta sketches are mergeable. This means you can work with rolled up data and merge the sketches over various time intervals. Thus, you can take advantage of Druid's rollup feature.
- Specific to sketches supported in Druid, Theta sketches support set operations. Given two Theta sketches over subsets of data, you can compute the union, intersection, or set difference of the two subsets. This enables you to answer questions like the number of visitors that watched a specific combination of episodes from the example.
In this tutorial, you will learn how to do the following:
- Create Theta sketches from your input data at ingestion time.
- Execute distinct count and set operation queries on the Theta sketches to explore the questions presented earlier.
Prerequisites
Before proceeding, download Druid as described in the single-machine quickstart and have it running on your local machine. You don't need to load any data into the Druid cluster.
It's helpful to have finished Tutorial: Loading a file and Tutorial: Querying data.
Sample data
This tutorial works with the following data:
- date: a timestamp. In this case it's just dates but as mentioned earlier, a finer granularity makes sense in real life.
- uid: a user ID
- show: name of a TV show
- episode: episode identifier
date,uid,show,episode
2022-05-19,alice,Game of Thrones,S1E1
2022-05-19,alice,Game of Thrones,S1E2
2022-05-19,alice,Game of Thrones,S1E1
2022-05-19,bob,Bridgerton,S1E1
2022-05-20,alice,Game of Thrones,S1E1
2022-05-20,carol,Bridgerton,S1E2
2022-05-20,dan,Bridgerton,S1E1
2022-05-21,alice,Game of Thrones,S1E1
2022-05-21,carol,Bridgerton,S1E1
2022-05-21,erin,Game of Thrones,S1E1
2022-05-21,alice,Bridgerton,S1E1
2022-05-22,bob,Game of Thrones,S1E1
2022-05-22,bob,Bridgerton,S1E1
2022-05-22,carol,Bridgerton,S1E2
2022-05-22,bob,Bridgerton,S1E1
2022-05-22,erin,Game of Thrones,S1E1
2022-05-22,erin,Bridgerton,S1E2
2022-05-23,erin,Game of Thrones,S1E1
2022-05-23,alice,Game of Thrones,S1E1
Ingest data using Theta sketches
Load the sample dataset using the INSERT INTO statement and the EXTERN function to ingest the sample data inline. In the Druid web console, go to the Query view and run the following query:
INSERT INTO "ts_tutorial"
WITH "source" AS (SELECT * FROM TABLE(
  EXTERN(
    '{"type":"inline","data":"date,uid,show,episode\n2022-05-19,alice,Game of Thrones,S1E1\n2022-05-19,alice,Game of Thrones,S1E2\n2022-05-19,alice,Game of Thrones,S1E1\n2022-05-19,bob,Bridgerton,S1E1\n2022-05-20,alice,Game of Thrones,S1E1\n2022-05-20,carol,Bridgerton,S1E2\n2022-05-20,dan,Bridgerton,S1E1\n2022-05-21,alice,Game of Thrones,S1E1\n2022-05-21,carol,Bridgerton,S1E1\n2022-05-21,erin,Game of Thrones,S1E1\n2022-05-21,alice,Bridgerton,S1E1\n2022-05-22,bob,Game of Thrones,S1E1\n2022-05-22,bob,Bridgerton,S1E1\n2022-05-22,carol,Bridgerton,S1E2\n2022-05-22,bob,Bridgerton,S1E1\n2022-05-22,erin,Game of Thrones,S1E1\n2022-05-22,erin,Bridgerton,S1E2\n2022-05-23,erin,Game of Thrones,S1E1\n2022-05-23,alice,Game of Thrones,S1E1"}',
    '{"type":"csv","findColumnsFromHeader":true}'
  )
) EXTEND ("date" VARCHAR, "show" VARCHAR, "episode" VARCHAR, "uid" VARCHAR))
SELECT
  TIME_FLOOR(TIME_PARSE("date"), 'P1D') AS "__time",
  "show",
  "episode",
  COUNT(*) AS "count",
  DS_THETA("uid") AS "theta_uid"
FROM "source"
GROUP BY 1, 2, 3
PARTITIONED BY DAY
Notice the theta_uid column in the SELECT statement. It defines the thetaSketch aggregator on the uid column during ingestion.
In this scenario you are not interested in individual user IDs, only the unique counts.
Instead you create Theta sketches on the values of uid using the DS_THETA function.
DS_THETA has an optional second parameter that controls the accuracy and size of the sketches.
The GROUP BY statement groups the entries for each episode of a show watched on the same day.
Query the Theta sketch column
Calculating a unique count estimate from a Theta sketch column involves the following steps:
- Merge the Theta sketches in the column by means of the
DS_THETAaggregator function in Druid SQL. - Retrieve the estimate from the merged sketch with the
THETA_SKETCH_ESTIMATEfunction.
Between steps 1 and 2, you can apply set functions as demonstrated later in Set operations.
Basic counting
Let's first see what the data looks like in Druid. Run the following SQL statement in the query editor:
SELECT * FROM ts_tutorial
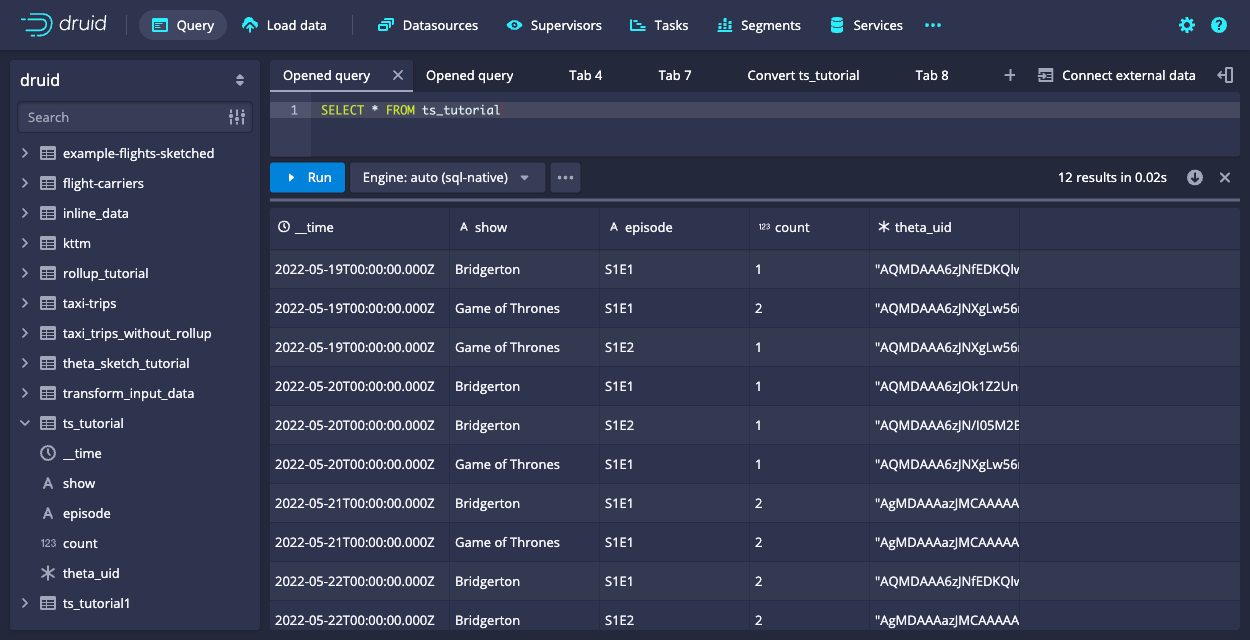
The Theta sketch column theta_uid appears as a Base64-encoded string; behind it is a bitmap.
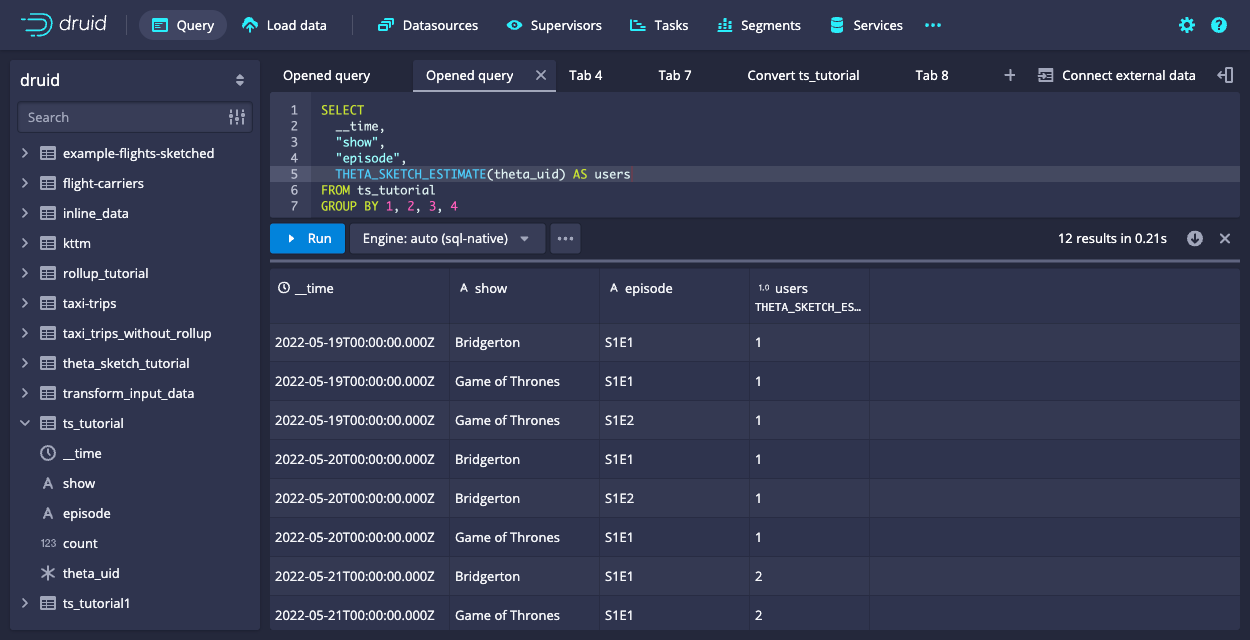
The following query uses THETA_SKETCH_ESTIMATE to compute the distinct counts of user IDs and groups by the other dimensions:
SELECT
  __time,
  "show",
  "episode",
  THETA_SKETCH_ESTIMATE(theta_uid) AS users
FROM ts_tutorial
Filtered metrics
Druid has the capability to use filtered metrics. This means you can include a WHERE clause in the SELECT part of the query.
In the case of Theta sketches, the filter clause has to be inserted between the aggregator and the estimator.
As an example, query the total unique users that watched Bridgerton:
SELECT APPROX_COUNT_DISTINCT_DS_THETA(theta_uid) FILTER(WHERE "show" = 'Bridgerton') AS users
FROM ts_tutorial
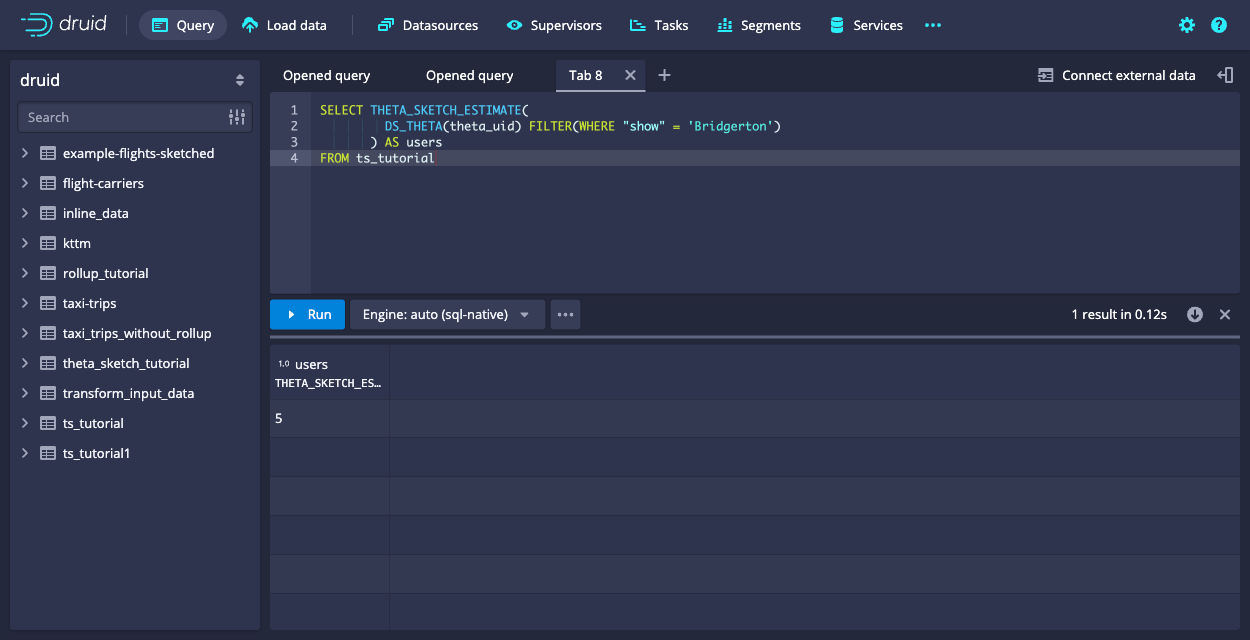
In the preceding query, APPROX_COUNT_DISTINCT_DS_THETA is equivalent to calling DS_THETA and THETA_SKETCH_ESIMATE as follows:
SELECT THETA_SKETCH_ESTIMATE(
         DS_THETA(theta_uid) FILTER(WHERE "show" = 'Bridgerton')
       ) AS users
FROM ts_tutorial
The APPROX_COUNT_DISTINCT_DS_THETA function applies the following:
DS_THETA: Creates a new Theta sketch from the column of Theta sketches.THETA_SKETCH_ESTIMATE: Calculates the distinct count estimate from the output ofDS_THETA.
Note that the filter clause limits an aggregation query to only the rows that match the filter.
Set operations
You can use this capability of filtering in the aggregator, together with set operations, to finally answer the questions from the introduction.
How many users watched both episodes of Bridgerton? Use THETA_SKETCH_INTERSECT to compute the unique count of the intersection of two (or more) segments:
SELECT THETA_SKETCH_ESTIMATE(
         THETA_SKETCH_INTERSECT(
           DS_THETA(theta_uid) FILTER(WHERE "show" = 'Bridgerton' AND "episode" = 'S1E1'),
           DS_THETA(theta_uid) FILTER(WHERE "show" = 'Bridgerton' AND "episode" = 'S1E2')
         )
       ) AS users
FROM ts_tutorial

Again, the set function is spliced in between the aggregator and the estimator.
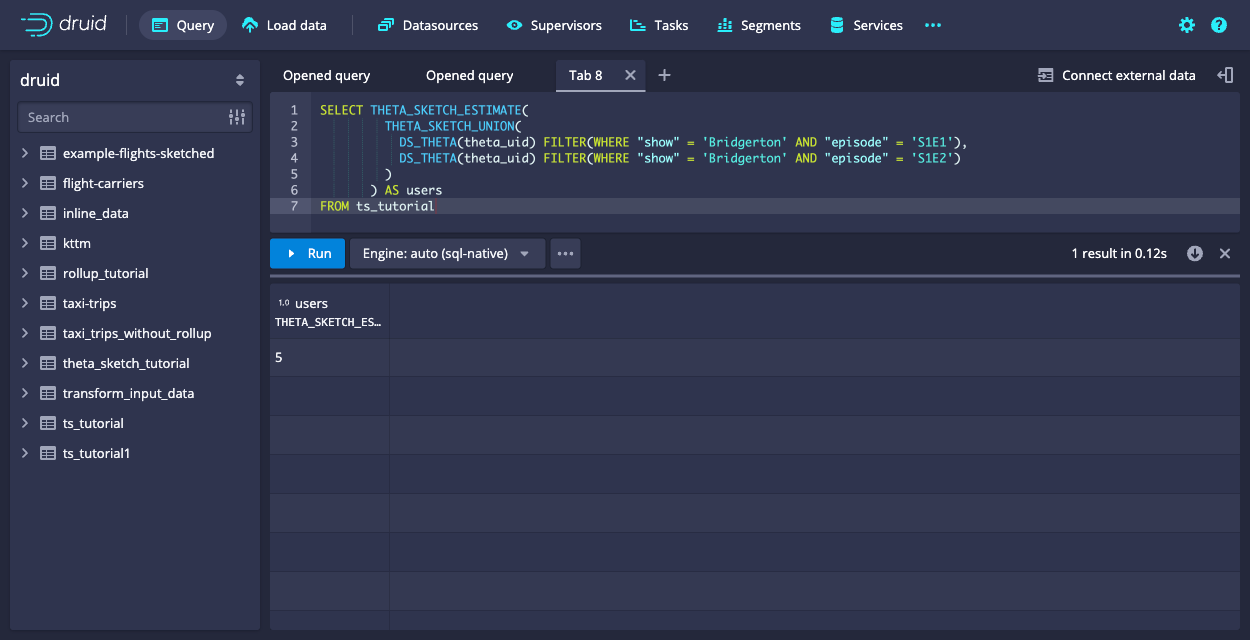
Likewise, use THETA_SKETCH_UNION to find the number of visitors that watched any of the episodes:
SELECT THETA_SKETCH_ESTIMATE(
         THETA_SKETCH_UNION(
           DS_THETA(theta_uid) FILTER(WHERE "show" = 'Bridgerton' AND "episode" = 'S1E1'),
           DS_THETA(theta_uid) FILTER(WHERE "show" = 'Bridgerton' AND "episode" = 'S1E2')
         )
       ) AS users
FROM ts_tutorial
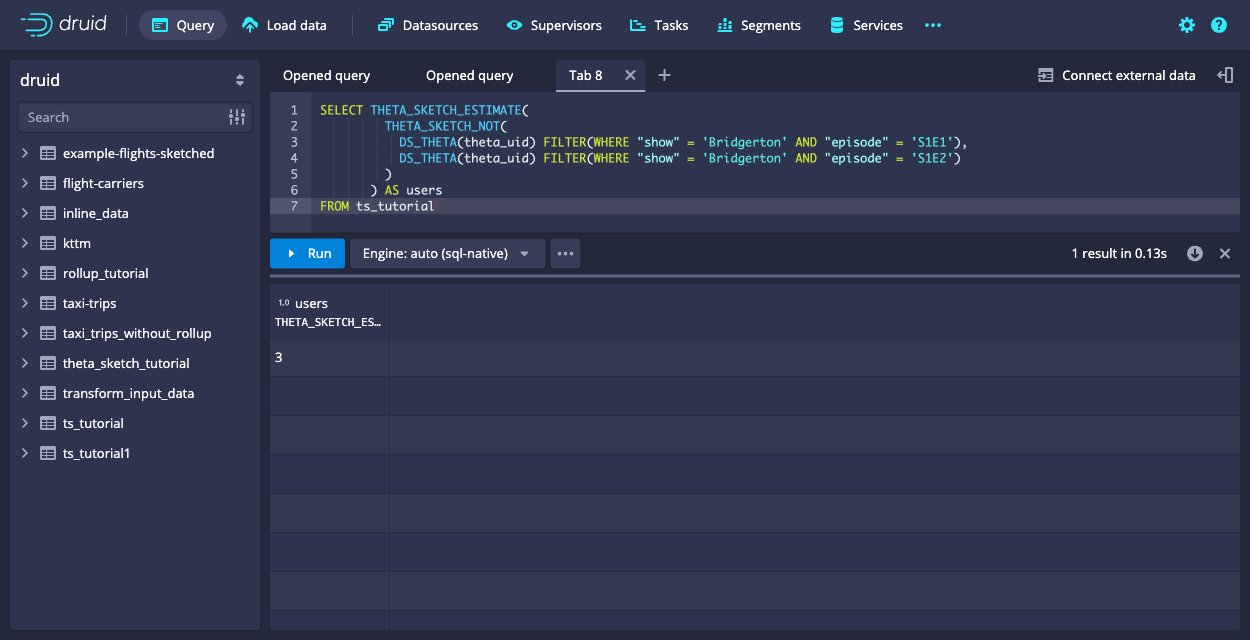
And finally, there is THETA_SKETCH_NOT which computes the set difference of two or more segments.
The result describes how many visitors watched episode 1 of Bridgerton but not episode 2.
SELECT THETA_SKETCH_ESTIMATE(
         THETA_SKETCH_NOT(
           DS_THETA(theta_uid) FILTER(WHERE "show" = 'Bridgerton' AND "episode" = 'S1E1'),
           DS_THETA(theta_uid) FILTER(WHERE "show" = 'Bridgerton' AND "episode" = 'S1E2')
         )
       ) AS users
FROM ts_tutorial
Conclusions
- Counting distinct things for large data sets can be done with Theta sketches in Apache Druid.
- This allows us to use rollup and discard the individual values, just retaining statistical approximations in the sketches.
- With Theta sketch set operations, affinity analysis is easier, for example, to answer questions such as which segments correlate or overlap by how much.
Learn more
See the following topics for more information:
- Theta sketch for reference on ingestion and native queries on Theta sketches in Druid.
- Theta sketch scalar functions and Theta sketch aggregation functions for Theta sketch functions in Druid SQL queries.
- Sketches for high cardinality columns for Druid schema design involving sketches.
- DataSketches extension for more information about the DataSketches extension in Druid as well as other available sketches.
- The accuracy of queries using Theta sketches is governed by the size k of the Theta sketch and by the operations you perform. See more details in the Apache DataSketches documentation.
Acknowledgments
This tutorial is adapted from a blog post by community member Hellmar Becker.
Footnotes
-
Why 15 minutes and not just 1 hour? Intervals of 15 minutes work better with international timezones because those are not always aligned by hour. India, for instance, is 30 minutes off, and Nepal is even 45 minutes off. With 15 minute aggregates, you can get hourly sums for any of those timezones, too! ↩